Let’s target MSPs · Field note 03
SaaS financials and PPS
Best viewed in landscape

This is the third post in this series, if you’ve not read the first post I’d recommend you skim it first for context. This will be a shorter post, I will be covering the modelling/finance side to working with MSP’s. As a reminder, here is what I’m covering in this series:
- What is an MSP? – Covered in post 1
- TAM/SAM – Covered in post 1
- What is an MSP? – Covered in post 1
- TAM/SAM – Covered in post 1
- Economics of an MSP and their customers – Covered in post 2
- Personas – Covered in post 2
- Vertical analysis – Covered in post 2
- Share of Wallet – Covered in post 2
- The assisted sale – Covered in this post
- Product Penetration Scale – Covered in this post
- Financial Modelling – Covered in this post
- SaaS metrics – Covered in this post
- Commercial agreements/billing – Covered in post 4
- Research, Analysts, consultants and forums – Covered in post 5
- Marketing and Shows – Covered in post 5
- RMM’s, PSA’s and integrations – Covered in post 6
- Product capabilities and principles – Covered in post 7
- ‘MSP team’ investment requirements – Covered in post 8
The Assisted Sale
In the first post I mentioned that one of the reasons vendors are attracted to MSP’s is the notion of the assisted sale. Essentially, the MSP is a channel through to the SMB, if you convince your channel partner (MSP) to push your service to their clients, then they will do the vast majority of the work as they onboard their base.
In general, MSP’s are far more effective at selling your service than a VAR or Distributor into their respective bases (at least from a % penetration perspective), the success of the assisted sale is predicated on how well you align as a vendor with the MSP’s needs as well as the maturity/sophistication of the MSP, which I talked about in the last post.
Significant investment is often needed to maximise the effectiveness of the Assisted Sale, such as training sessions, copious amount of collateral and often partnering on certain sales deals, but once you get over the hump with the MSP’s this is where the magic happens and you will experience the thrilling feeling of the pull from the market and you’d better be prepared to scale!
From a financial modelling perspective, this is where the MSP Persona’s and the TAM/SAM data comes in, but before going into this, I want to highlight something I call the Product Penetration Scale…
Product Penetration Scale (PPS)
Before I worked with MSP’s I had been used to the idea that you work with a single business client of x size and if you close that deal, you can almost guarantee that you will gain 100% deployment/penetration of your product in that account. Businesses are rarely looking to manage multiple solutions of the same type, especially when dealing with SMB’s.
As I worked with MSP’s I was a little confused with the fact that we would sell to an MSP and we would see only 20% or 50% penetration into that MSP’s client base with certain products and nearly 100% with other products. Diving in with the MSP’s it was evident that there are multiple factors in play which may mean that you need to reset expectations on the MSP opportunity for you as a vendor, such as:
- Product is niche and only applies to certain use cases/vertical of the MSP’s client
- MSP does not understand your service
- Product is deemed expensive and the MSP struggles to sell to certain clients
- Product is too hard to manage and causes friction for the MSP
- Product is only used by the MSP’s operations, not their clients
- Client wishes to keep a competitive solution (pretty rare)
To illustrate this I like to think of Products sitting on a scale of 3 tiers, based on the expected % penetration into the MSP’s client base within 3-6 months. This became very important when plugging in these assumptions into forecasting/modelling and ultimately deciding whether the proposed product is viable for the MSP market.
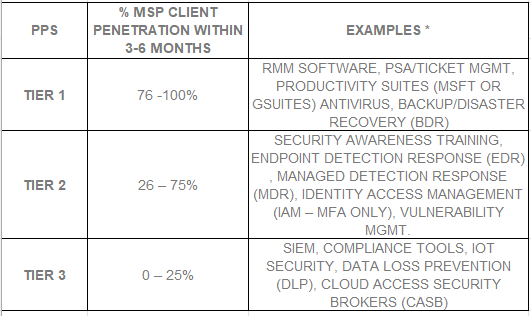
*Heavily skewed toward the cybersecurity world I’ve lived in for years!
I should state that the examples are based on these products meeting the MSP’s needs and aligning with the Product Principles which I will cover in my next post. Also, the MSP maturity plays a big factor here as noted in my last post when detailing the nuances between MSP, Medium and Large MSP’s will do a better job penetrating your product in their base than small MSP’s.
I’m not saying that if you have a product in Tier 3 that it’s not viable, but just that you should carefully understand the economics before you commit too many resources.
Financial Modelling
I don’t expect my PM’s to be financial experts, but every Product Manager should be comfortable with working with sales and finance teams to assist in building out models based on data and assumptions they supply.
So far in this series we’ve gathered 3 key inputs for our assumptions:
- TAM/SAM… and SOM (Serviceable Obtainable Market – the size of the target market and what is realistically obtainable)
- MSP personas and size buckets (where your service plays best and the market size)
- Product Penetration Scale (how much adoption within the MSP you’d expect)
With the above, you should be able to work with sales and finance to understand what this service may look like in the market. Another variable is the primary channel(s) that you will be acquiring the MSP’s from, there are a few different ways to acquire MSP’s which I’ll cover in the next post.
As the model comes together, you start to ask questions about churn/retention rates and even dive into COGs (Cost of Goods), this is where having a solid understanding of SaaS metrics comes in…
SaaS Metrics
I don’t think I know of any successful software vendor in the MSP space who is not doing SaaS sales of their product. Traditional/perpetual licence sales are dead and have no place in the MSP world, there are a few obvious factors why this is, but maybe something that may have be new to you was highlighted in my last post as I talked about the economics of the MSP and the way the engage and bill their clients on a monthly basis (although have annual commits).
Having worked with a few smaller SaaS companies over the years whether directly, via M&A or advisory, something that I get most frustrated about is that the business and their portfolio is not always being properly measured, leaving the team flying blind and making it incredibly difficult to assess the health of the business. Not only this, it can have an adverse effect on valuations and even worse, teams getting a nasty shock as money runs out.
The key SaaS metrics I look for are from a Product perspective are:
- Churn/Retention Rate
- Conversion/Activation Rate
- LTV:CAC Ratio:
- Lifetime Value (LTV)
- Customer Acquisition Cost (CAC)
- Monthly Recurring Revenue (MRR)
…Not strictly SaaS but adding in a few more key metrics:
- Cost of Goods sold (COGS)
- Net Promoter Score (NPS)
- Customer Satisfaction Scores (CSAT)
Of course, good finance teams are going to be looking beyond these metrics and at the health of the business from a myriad of angles with all sorts of ‘Magic’ numbers, rules and ratios that are derived by properly instrumenting the business financials.
From a leadership perspective, my favourite metric is the LTV:CAC ratio, as this gives the quickest view on product/portfolio health when looking at how much revenue you expect from a customer over their lifetime (factoring in churn) vs. the costs to acquire them. COGS are also critical to understand as you look at the direct costs of your service as you want to target <10-15% of revenue, although there’s nuances here based on the product type, maturity and competitive landscape.
For vendors targeting the MSP, I have seen a bunch of ratios across cybersecurity technologies targeting the MSP and can share that a LTV:CAC ratio of 6:1 is where you need to be to have a strong business.
There is an argument that you may be underspending on marketing if your ratio is this high, but my take is that this factors in the expansion dynamics of the MSP’s business mentioned in my first post.
This is just my take, but as always, I’ll leave to the finance experts to guide us!
Lastly, running continuous customer satisfaction (CSAT), as well as bi-annual Net-promoter Score (NPS) surveys is an absolute must! These allow you to keep a finger on the pulse of your base and spot any issues or opportunities with very little work.
Product teams often get into the bad habits of just building and shipping without measuring and learning from their customer base, there have been countless occasions where the team spotted a trend in the CSAT or NPS which has an impact on churn rates, catching this early and reacting quickly can be the best investment your teams make!
Running these surveys is a breeze and there are a bunch of tools out there which can automate this for you, you just need to make sure you target the right role/audience and present it in the right way. Reach out if you’d like a recommendation on how to do this.